Skewness is a distortion or asymmetry. It means to give an oblique direction or form to something.
Our perception is skewed when it is not in line, not running parallel to conventions. One can even skew the course or glace askew at someone.
In probability theory, skewness takes a more technical definition. It describes how a model or sample distribution varies from the normal distribution or classic bell curve.
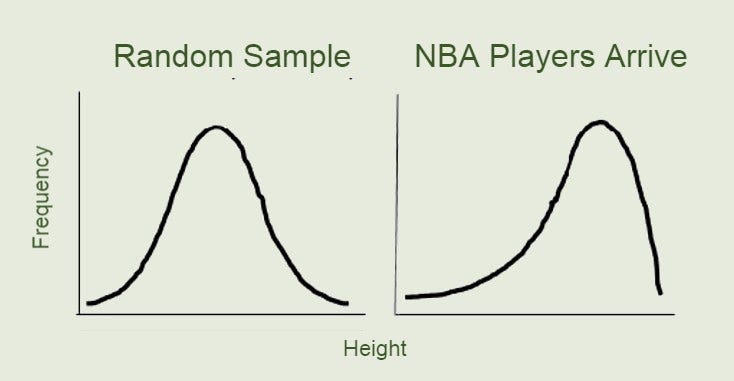
The height of humans is one of the most powerful natural examples of a bell curve. Take a random sample of people, and their heights will very closely fall along the normal distribution. Lots of people between 5 and 6 feet, and very few 8 footers.
If you waited at your local mall to sample 100 people, and a couple of NBA teams happened to walk past, your observed distribution would demonstrate a skewness not expected from a broader and more representative sample.
For options traders, skews are smiles and frowns. Yes, they can bring smiles to those who recognize their importance, and frowns to those who ignore them. But the smile or frown describes the shape of skew they might be observing in the marketplace.
Within the same expiration, there are options listed at many different strike prices. These all have prices in the marketplace that are a function of supply and demand for those options, and mathematical relationships between the probabilities of each option’s expected value.
The implied volatility of each option can be reverse engineered from its market price, and when we plot them on a chart, the curve is the skew of that series of options. How much investors are willing to pay or receive for a given option represents their expectation of the future.
For most equity markets, the typical shape of a skew is a downward sloping curve, with the highest implied volatility to the downside. Typical explanations are orderflow driven - there are more buyers of protection (out of the money puts) and sellers of expectations (out of the money calls). There is also the correlation between spot price and volatility - when stocks go down, volatility usually goes up, so downside volatility should be more expensive.
A smile in a skew curve means that the “wings” or far out of the money options are being bid up. Options that are out of the money to the upside being priced more than the at the money options means investors are expecting directional moves to the upside and increased volatility with the same.
This type of smile is more common in commodity products. When the price of corn goes up, that’s likely indicative of more volatile circumstances such as a drought or blight. It’s also very common in the crypto currency market.
Options for both Bitcoin and Ethereum have long demonstrated upside smile or skew. There is a lot of demand for upside exposure, and not as much interest in downside protection. While much of this can be attributed to retail enthusiasm, billions of dollars are trading on these platforms amongst professional investors who are also playing the game every day.
A common benchmark to compare the skewness of a product is looking at options that are the same relative distance in delta from the money. For the S&P 500, the 25 delta puts are 6 points higher in volatility terms than the 25 delta calls - investors bid up protection. In Bitcoin, the 25 delta calls are about 5 points higher than the puts - almost the exact opposite.
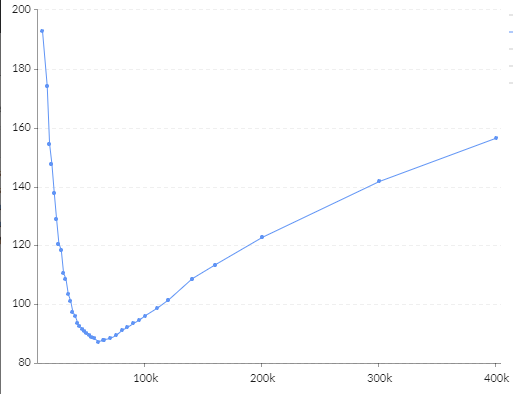
The below chart shows options on Bitcoin expiring at the end of the year. The nadir of that curve is right where the current price is, and the further away we get, the higher implied volatility gets.
What is this skewness telling us? It’s ultimately the product of orderflow - markets create prices that match buyers and sellers. There still remains lots of speculative fervor about the future potential of crypto assets. It’s also a function of overall uncertainty, and still nascent markets with sharp price action.
High upside skewness combined with high volatility (Bitcoin is about 5x the vol of the S&P500, Ethereum is about 7x) can create some mind bending scenarios. At the money calls in these products 6 months away are trading for nearly 50% of the value of the underlying. When you give a 75-100 vol asset 180 days to bounce around - there are a lot of price paths that must be accounted for.
When we see skew curves that move up and to the right, there’s good reason to believe that price charts will follow. High volatility can create many different outcomes when given a long enough timeline.


