
When you win
Vol #276: June 4th, 2026

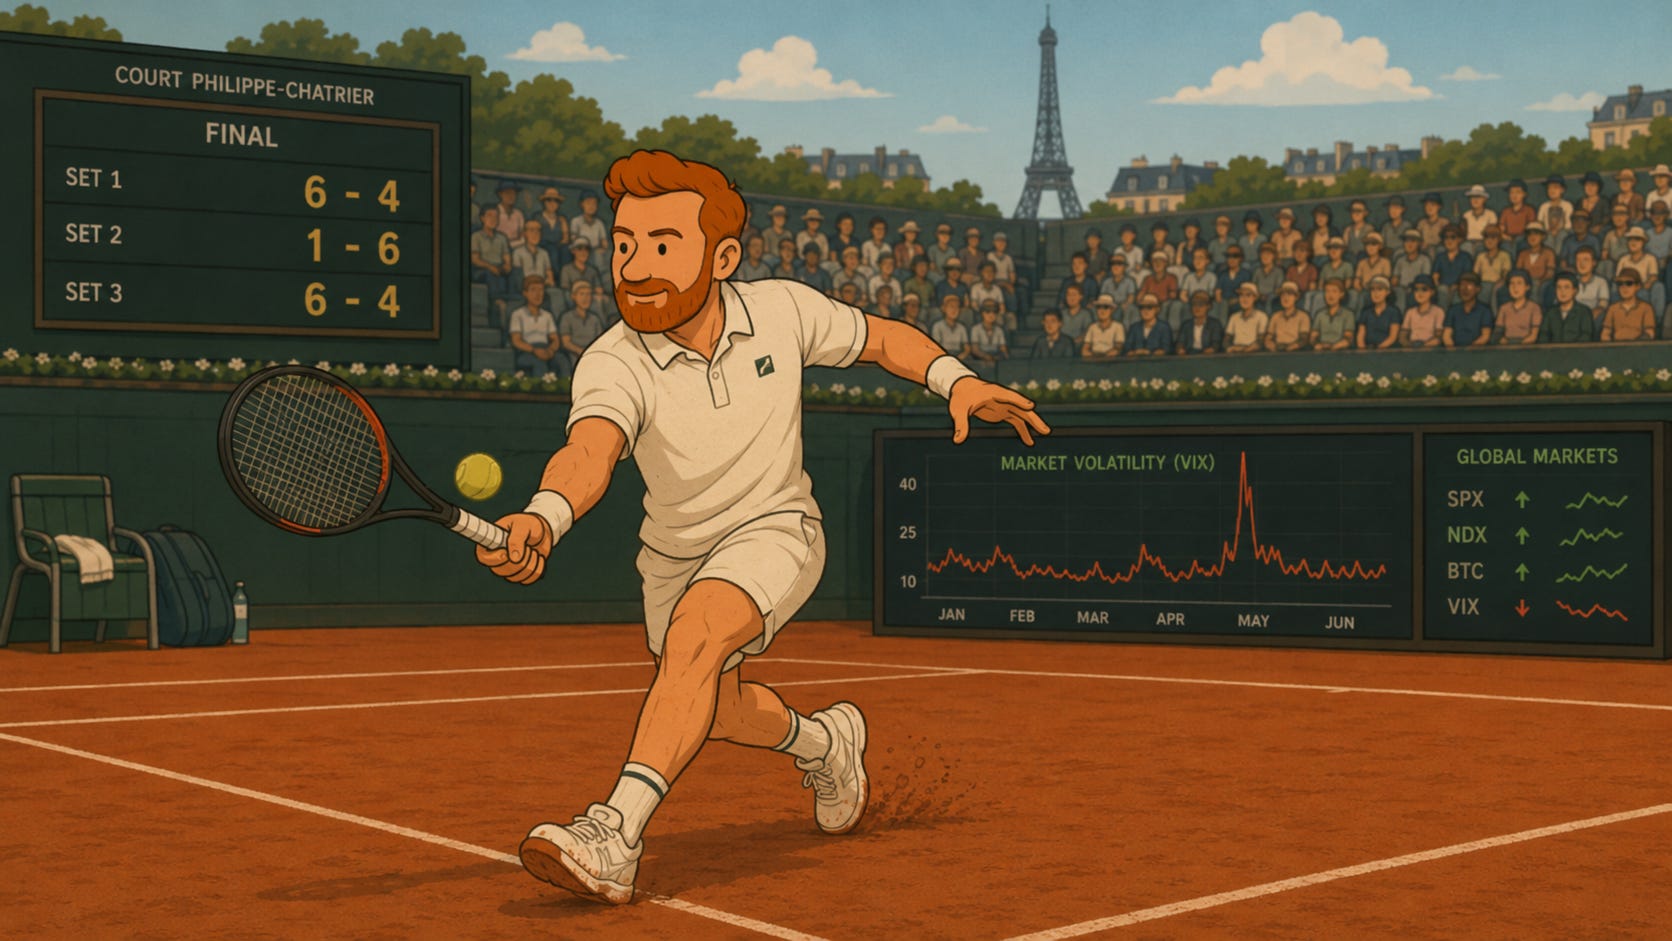
It’s not always what or how you win, but when you win.
In a tennis game the other night, the winners in a best of three sets match took the series 6-4, 1-6, 6-4. The losers won more individual games (14 vs 13), and therefore more points. But they still lost.
There are several ways that could happen, and all of them are frustrating. You see this in any sport where matches are tallied as the aggregate of individual scores. And it’s not just beer league tennis - the 2013 NBA finals saw the Spurs scoring five more total points but losing in seven games to the Heat.
The obvious similarity between these two examples (besides the level of competition) is that the loser lands a major blowout in one of their winning games. Dominating your opponent in one feat might feel good at the moment, but it still only notches one win.
The rules are known well in advance to all, and taking advantage of scoring aggregation dynamics is its own form of strategy. If the players who won the first set find themselves down 4-1 in the second, it might make sense to quickly drop the next two games and save your energy for the rubber match.
For sports that are won in best-of series, or playoffs that are earned across the wins and losses of a season, consistency is rewarded. It’s better to win a lot of close matches than to put on a performance clinic one lonely evening.
The teams that can deliver the blowouts are often the same ones who win the close matches. But there are many exceptions. Lots of games are played because you want to eliminate the luck factor.
Another way of thinking about that is you want to remove volatility from the results. Variance is not just constrained to financial markets - they just happen to be a very quantifiable demonstration of it. Choosing the victor of New Canaan vs. Redding is no different than measuring the best performing stock of the year. The overall winner doesn’t take every game or close the highest on every single day.
If you’re going to disaggregate performance into the daily, weekly, or monthly slices that make up a year, where you draw the lines matters. Trading an options strategy, every expiration is a performance line in the sand. Settlement doesn’t care about what you did last week or will do next month, it’s all about the print at 4:00PM eastern on any given Friday.
By creating time buckets of performance, you’re taking an opinion on volatility. Direction comes on its own schedule, and the path is never straight. The weighting flows of buyers and sellers bring valuations closer to truth - over time. When the true value is uncertain, we will see a wider range of prices along the way.
Selling a covered call is defining a stock’s performance within a specific period. If you own equity outright, the best case scenario this month is unlimited. With a short call option it’s the strike price plus whatever you collected in premium.
The biggest question in an overwriting strategy is where to draw those lines in time and strike space. If we look at a stock’s history and expect it to go up 12% in a year, you can’t just sell 1% OTM calls every month. For reasons of path and compounding, it doesn’t break down neatly.
Last year SPX was up 16.3%, and 92% of those dollar gains took place in only three calendar months. May, June, and September saw 6.1%, 4.2% and 4.4% gains. If you sold a 1.33% OTM call (16% total performance divided by 12 months) it seems like you might be giving away a lot of upside. Is the premium worth it?
In June and September implieds were similar - around 12-14% - and so the 1.33% out of the money call was a 40 delta, and worth just over 1% of the underlying. May was still spooked by the great Tariff Tantrum, so you had an 18% vol call worth 1.5% of the spot. The best case scenario for June/September you can make up to 2.3% in a month with about 50bps more in May. Which leaves almost 9% on the table across these three blowout months.
But overall the premium collections are meaningful - this is the real draw to the strategy. At an average of 1.19% per month there is significant cash flow. That cash can compound both for and against you. When stocks are realizing less than that 1.33% increase, you have extra cash to buy more shares at lower, or at least less high prices.
While drawdowns are painful and less money is usually worse, upside volatility is your drag versus the benchmark. We can see below that it’s the May, June, and September periods when the covered call underperforms. When the benchmark is compounding above your strike, the strategy falls further behind.

For calendar year 2025 the monthly 1.33% covered call runs very close to the index. But this whole experiment was stylized knowing the total returns of the index. Even if you had a Magic 8 Ball, a covered call is basically even with buy and hold. The SPX-Write also assumes perfectly frictionless compounding, and the ability to overwrite 100% of your shares at all times - not practical without very large sums of money.
Longer term average returns are closer to 10%, so selling a closer to the money call at 83bps might be more reasonable. Interestingly, there’s hardly any difference in returns. Slightly higher lows, and a few bucks more at the end of the day.
As I’m fond of saying, it’s incredible how well volatility is priced these days. The upside premium collected in exchange for the right tail of returns was a very fair trade in 2025. That’s not always the case though.
In downward trending markets the 1.2% a month cash is some padding, but it’s not exactly a real offset. What you really want to think about with the covered call, is the upside directional volatility. Does this stock or index have the possibility to spiral up all at once and leave me totally behind?
Sports scores don’t compound, so there’s no advantage to winning when you’re already ahead. A game is a game and a point is a point. When your financial returns come is very meaningful. Volatile results hurt a team because they’re going to notch up more losses. But as we get into higher volatility stocks, the drag on compounding becomes more significant.
If you look at the skew curve, and plot the covered call strike, it’s fairly obvious that you’re selling upside volatility. But what exactly that means gets obfuscated by premiums and potential upside.
Whether buying or selling options, when matters. If the sequence of returns is unfavorable, you might find yourself winning games but losing matches.