


Because I’m so excited about the mechanism developed here, this edition of Portfolio Design is completely free.
If you like what you see, please share and consider subscribing.
Happy Trading.
Turning stock into cash isn’t alchemy.
Simply hit the red sell button, and after a few microseconds of routing and best execution the cash lands in your account. ACH transfers may take 2-3 business days.
Selling calls is only a little bit harder. The most intimidating part is the paradox of choice - expiring today there are 90 different out of the money strikes in SPY available. Beyond that, the mechanics, margin, and outcomes are straightforward.
But finance is a dynamic problem, and there are no permanent solutions. The “right” choice today could lead to the opposite result in different market conditions. The past quarter has shown us that SPY $580 has a very different feeling depending on which direction you’re coming from.
An important part of both an options contract and a trading system is rigor. The objective of creating cash out of investments demands consistency and specific outcomes. Yet that enforcement mechanism does not need to be structured in the same way every time.
Because prices adapt, so must we. At every trading interval there are new points of light, and our returns have followed a given path. You can’t change either results or facts, so you adjust the sails and tack forward.
Good traders observe, react, and adjust. The most durable edge available is being nimble. There’s no perfect time of day to enter a position, market indicator that screams buy, or ideal delta to sell covered calls.
The good news is, building reactivity into a system is both possible and easy. The objective can remain fixed, while the implementation adjusts to the realities of the current landscape. The logic here isn’t particularly advanced, it’s simply designed to float without sinking. You can’t fight the tape, but you can do significantly better than an arbitrary or blindly systematic strategy.
Today we’re going to feature a different flavor of Product Reviews. The YieldMax suite of offerings has grown to over $11.5B in AUM by creating distribution focused products. By overlaying some of the most popular equities with options, there is a menu of different flavors and potential outcomes.
Let’s dig into how you can improve capital retention, tax performance, and overall yield.
There are three key elements to a distribution strategy. You want to keep as much of the principle as possible so you can maintain or even grow the payouts. Right alongside that is generating elevated and consistent cashflow. The third, and most complicated quirk is keeping that optimized for taxes.
The choice of underlying is always the most important decision you can make with an options strategy. When incorporating elements of implied volatility into your portfolio where the stock goes is how returns are made and lost.
With 62 tickers on the menu (including short structures - but that’s an entirely different post), there is something for everyone. Mag7 names are popular as they have both the equity strength and relatively high implied volatilities. But old economy stalwarts can also produce steady and meaningful returns with this strategy. And then there’s crypto.
We’ll review the following pairs here: APLY (AAPL), AMZY (AMZN), JPMO (JPM), MSFO (MSFT), DISO (DIS), CONY (COIN), and XOMO (XOM). Most are relatively new and were launched in 2023, so we only have 18-24 months of comparison.
Credit where it’s due, there has been quite a bit of innovation in the YieldMax space. Their holdings show relatively complex positions, with short options laddered across different strikes, and options combos for capital efficiency. While much of what you get in an ETF is Grocery Store Sushi, I’ll concede there are certain advantages to doing this trade at scale.
A “combo” is floor jargon for a synthetic stock position where you’re long a call and short a put on the same strike. This “delta 1” position mimics the rise and fall of the stock price with significantly less margin requirement. This frees up the balance sheet to invest up to 85% in short term treasury securities providing an annual yield tailwind of 3-4%. Individuals could do that too, but it’s another layer of detail to manage. (Or have your advisor do it.)
The second *slight* advantage of a fund is the scale available. Options require round lots of 100 shares, and to achieve the desired granularity of an overlay that generates distributions bigger is better. With only 1000 shares, the minimum size is 10% of your holdings, far more cash than you’d want to generate on a monthly basis.
The size difference doesn’t always show as strongly in returns as you might expect. Given that I’ve placed a distribution cap at 150% of the target, to the extent that it does sell that call and get back 10% of the shares, it won’t trade again until the cash has been distributed. An assigment puts you out of trading for several cycles, reducing your at-bats and making them each more significant.

A few big sales drive the distributions in the 1k example, while the 10k example is gradually selling all along. Yet at the end of the period, they end up in a very similar place. The same goes for returns.
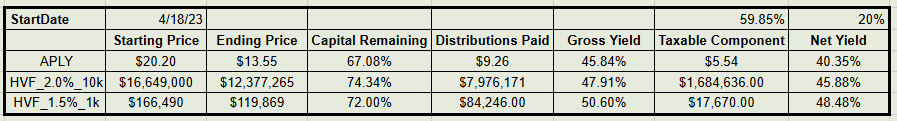
Above we have three different comparisons, the APLY ETF, the Harvested strategy of targeting 2% yield on 10k shares, and targeting 1.5% on 1,000 shares. The target is important because that drives the sizing and strike selection. We have to adjust the target artificially low when sizes are smaller to account for that minimum increment.
While the numbers are wildly different for portfolio size, the capital remaining element tracks how much of your balance is still active and generating ongoing distributions. Gross Yield is simply the sum of all the distributions paid divided by the starting price.
The taxable component is the biggest variable. For an ETF, at every distribution a 19a-1 notice is put out, indicating what percentage of the distribution is a return of capital (not taxed today but reduces basis) and what is net investment income. In the APLY example above, their last notice indicated cumulative taxable components of 59.85%, which yields the $5.54 of distributions that must be taxed. Of that NII component, some might be long term, and some might be short term capital gains. For simplicities sake, we assume a flat tax rate of 20%.
Operating this trade yourself, you’ll also have a mix. That is tracked at each share sale, in a similar method to an ETF, so that capital gains, options premiums, dividends, and interest are separated. Again we assumed a flat tax rate of 20%, same as the ETF.
Whether you’re using 10,000 shares or only 1,000 of AAPL, following the size and strike algorithm achieved superior gross and net yields, and left the investor with a higher capital account balance. While all of these are conditional on the relatively short track record of comparison, this same dynamic was true in all of the seven selected stocks.
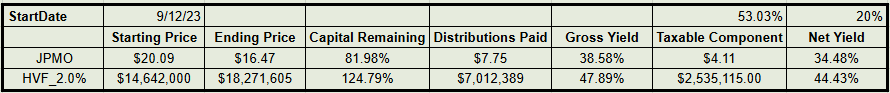
By adjusting the distribution knobs, one can bias the strategy to preserve more capital or yield more. That’s not going to be available in an ETF. Further, in a case like JPM you can have your cake and eat it too - literally.
Thanks to stock performance and some deft trading, with HVF_JPM targeting 2% distributions, you not only end up with an average monthly distribution amount of 2% with a tight and consistent range, the baseline pie is getting bigger. And the distributions are more tax efficient.
Generally speaking, the higher volatility names produced higher distributions, but also saw more range of their monthly figures. As we see in COIN below, those distributions were rather variable.

COIN also provides an interesting case study in the cost of demanding these distributions, as viewed through the lens of principal balance.
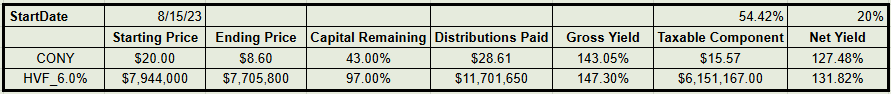
The HVF strategy aims for 6% (roughly CONYs average), and both gross and net yield figures are fairly close. Yet the capital remaining is more than double with the HVF strategy. The demand for those high distributions erodes value over time, and structuring caps potential gains. Both strategies saw a very nice last day mark earlier this week as Coinbase was added to the S&P 500 and stock jumped 23%.

Each strategy is interesting to compare in its own right. Like JPM, on the back of strong stock performance, running this strategy with META returns a higher capital balance alongside 3.5% monthly distributions. AMZN and MSFT also manage to deliver high yields and only suffer moderate capital drawdowns.
If you’re going to engage in this strategy, it’s important to understand how the demands for distributions will impact your capital balance. That’s a fine position to be in, but you can’t expect to take 40% a year out of a stock that’s not growing 40% a year and keep your principal. And 40% is a lot.
There isn’t much of a trick to balancing your deltas and overlay percentages based on cash amounts, and if you’re interested in learning more, shoot me a message. The full details for the examined strategies are available here.
Trading for yourself has its costs. Every month there’s a position to manage, and it gets even more complicated if you’re trying to get fancy with combos and multiple strikes. There’s also a lot to be said for being able to only buy one share for $20 and call it a day.
But don’t let the big balances intimidate you here. As we saw with AAPL, there’s still a benefit even if you only have 1,000 shares. If you’d taken $166k to buy APLY instead at the start, you’d have an $8,188 lower principal balance and $7,924 less in your dividend cash balance. That puts a new Rolex on your wrist every two years.
And if you’re not one to spend, for the 30 minutes you’ll take once a month, assume an hourly rate of $1340.
Interested in the results but not the work? Reach out and I can get you the best of both worlds.